
A blanket that tells the story of history and climate change.
The Carlisle Climate Blanket
A knitted blanket that reflects historic events from 1901-2020 in Carlisle, (and the state, the USA and globally), in a blanket. 1901 starts with the preservation of the tall pines, and 2020 is the pandemic.
The different colors of the squares represent the changes in the climate from an average temperature between 1895-2021. Beige is the average, blues are-2F to -4F, greens are -0.5F to -1F, yellow and orange +1F, reds +2 to +4F. This information came from the University of Reading UK climate stripes research. https://showyourstripes.info/s/globe I changed the colors as most yarn doesn't come in seven shades of blue and red.
The tree panel represents " The City in the Woods" as in that year nothing significant happened. Houses were used to represent growth, The house styles changed and the house sizes increased over the decades.
I am investigating different visual ways, apart from graphs that people can comprehend how the climate is changing.

Blanket

Temperature Change Index

Temperature change index

1911-1920

1921-1930
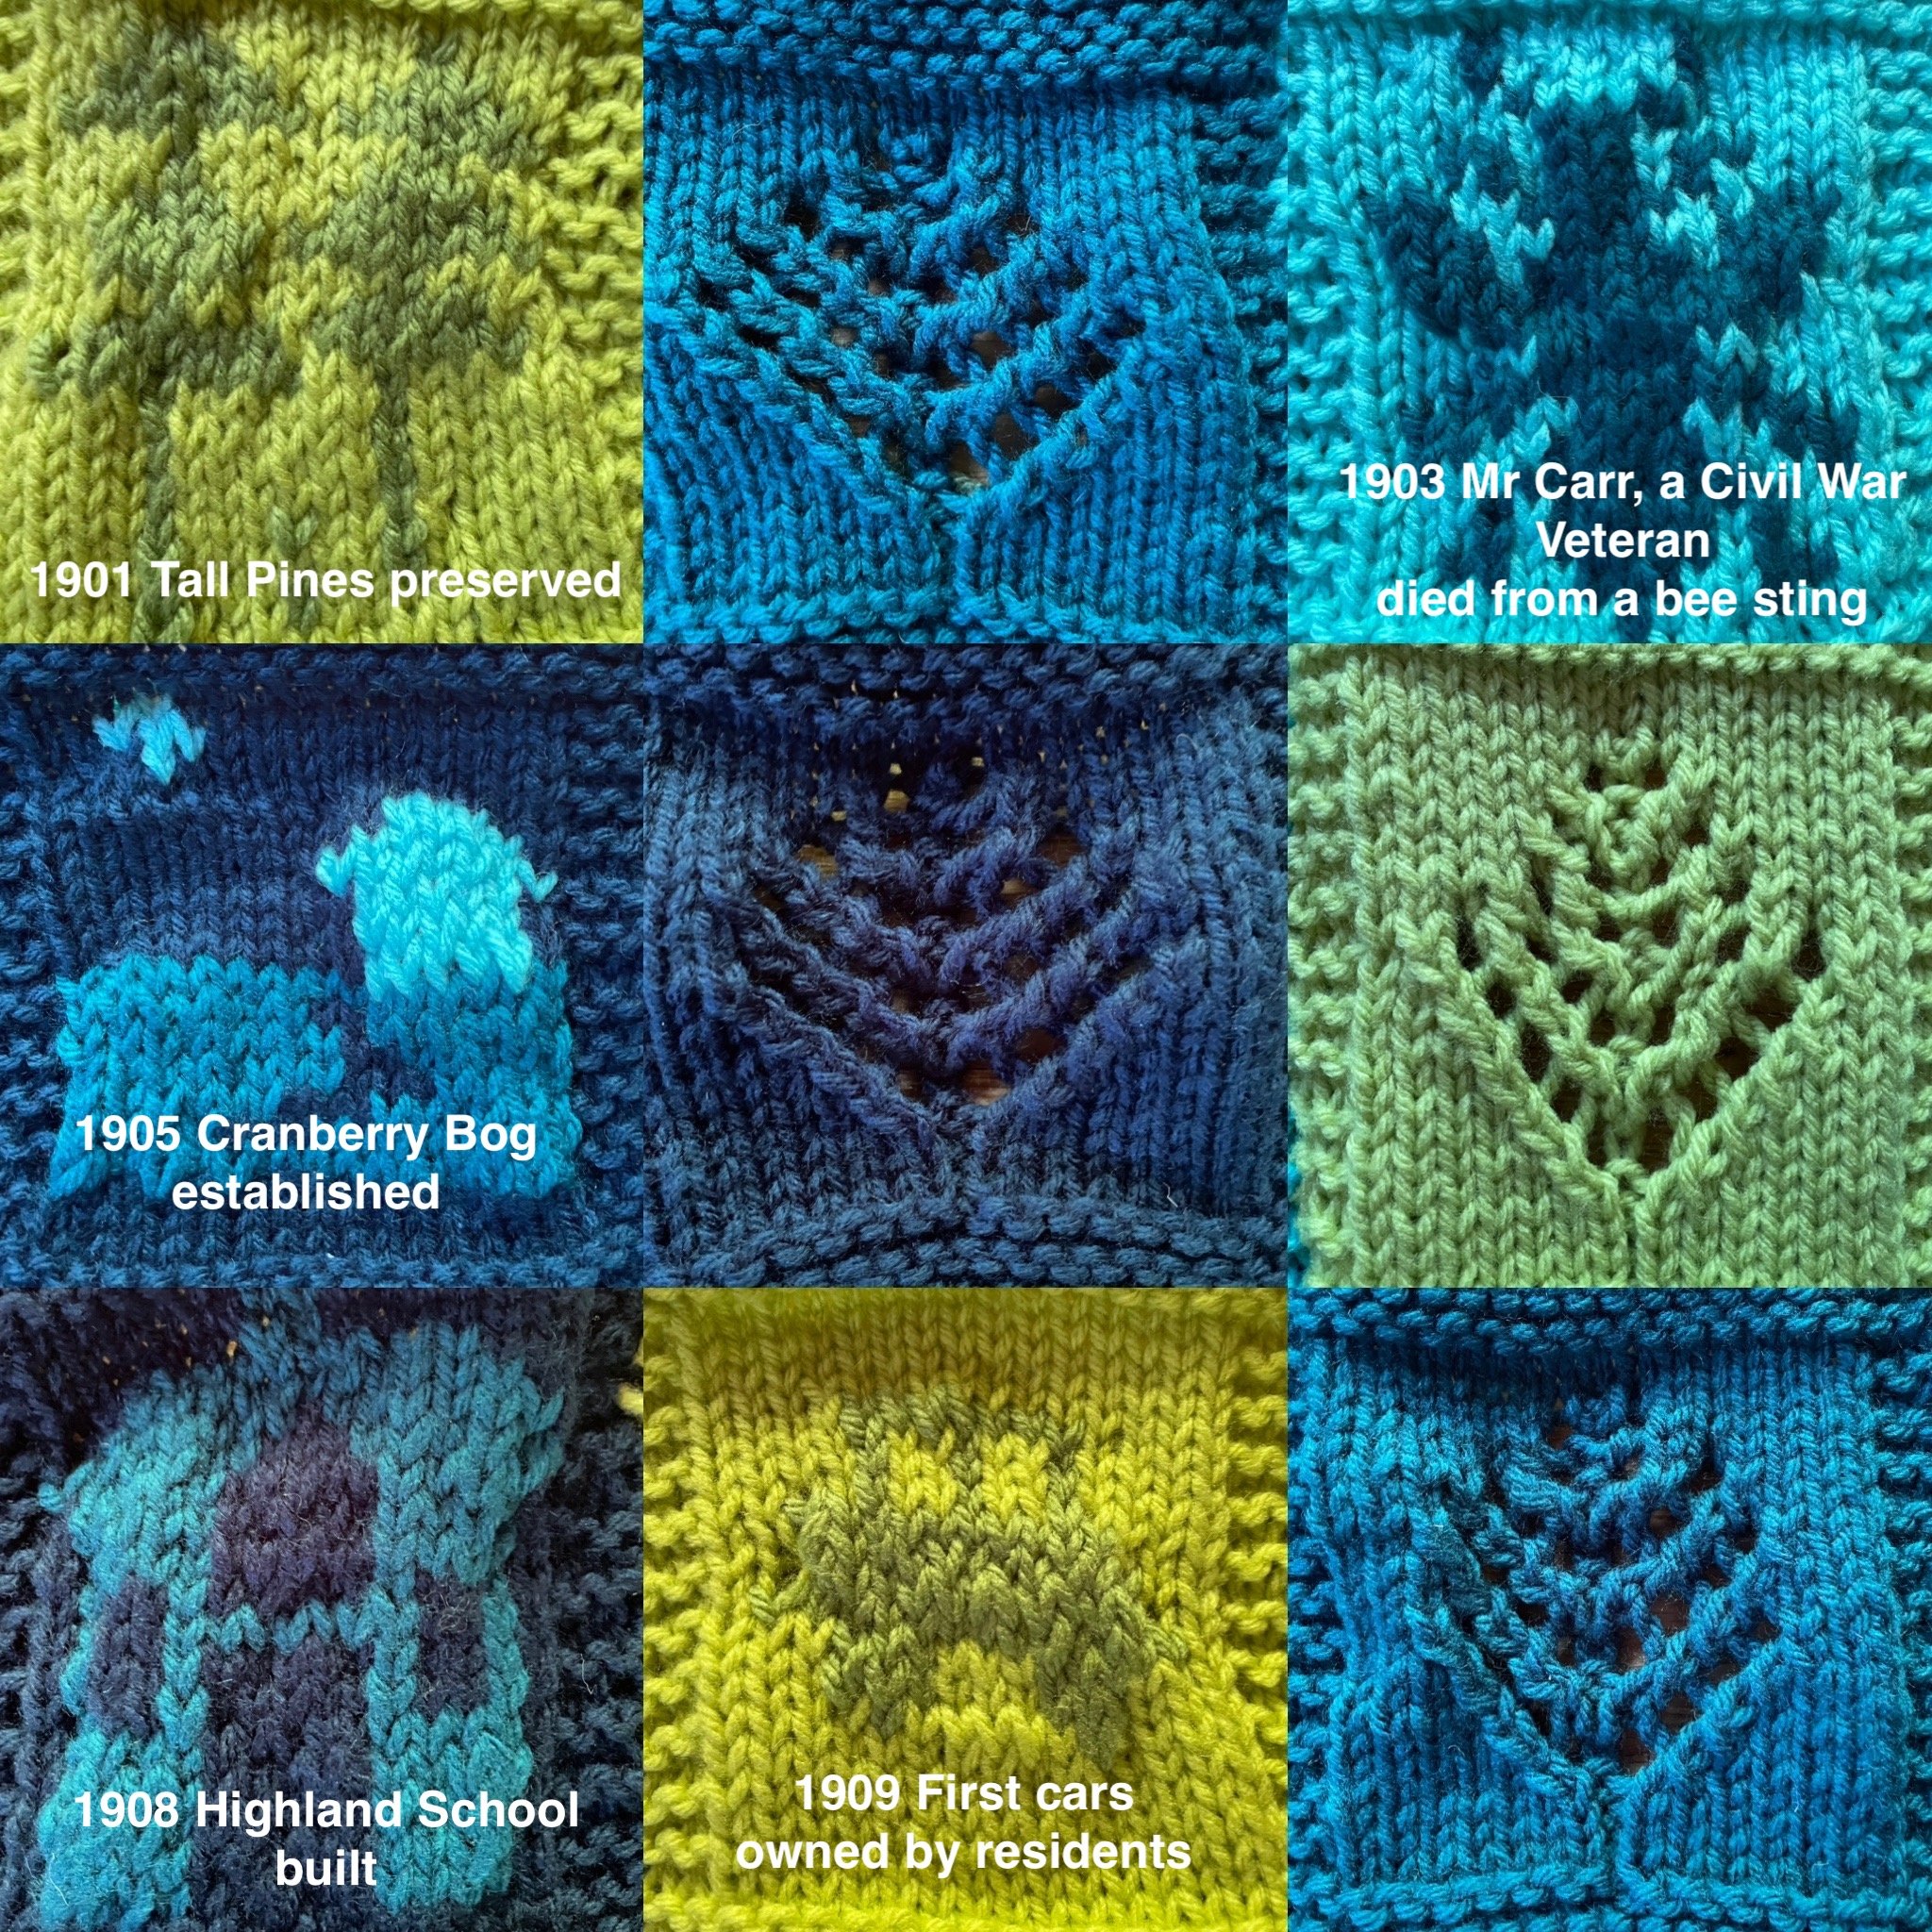
1901-1910

1941-50
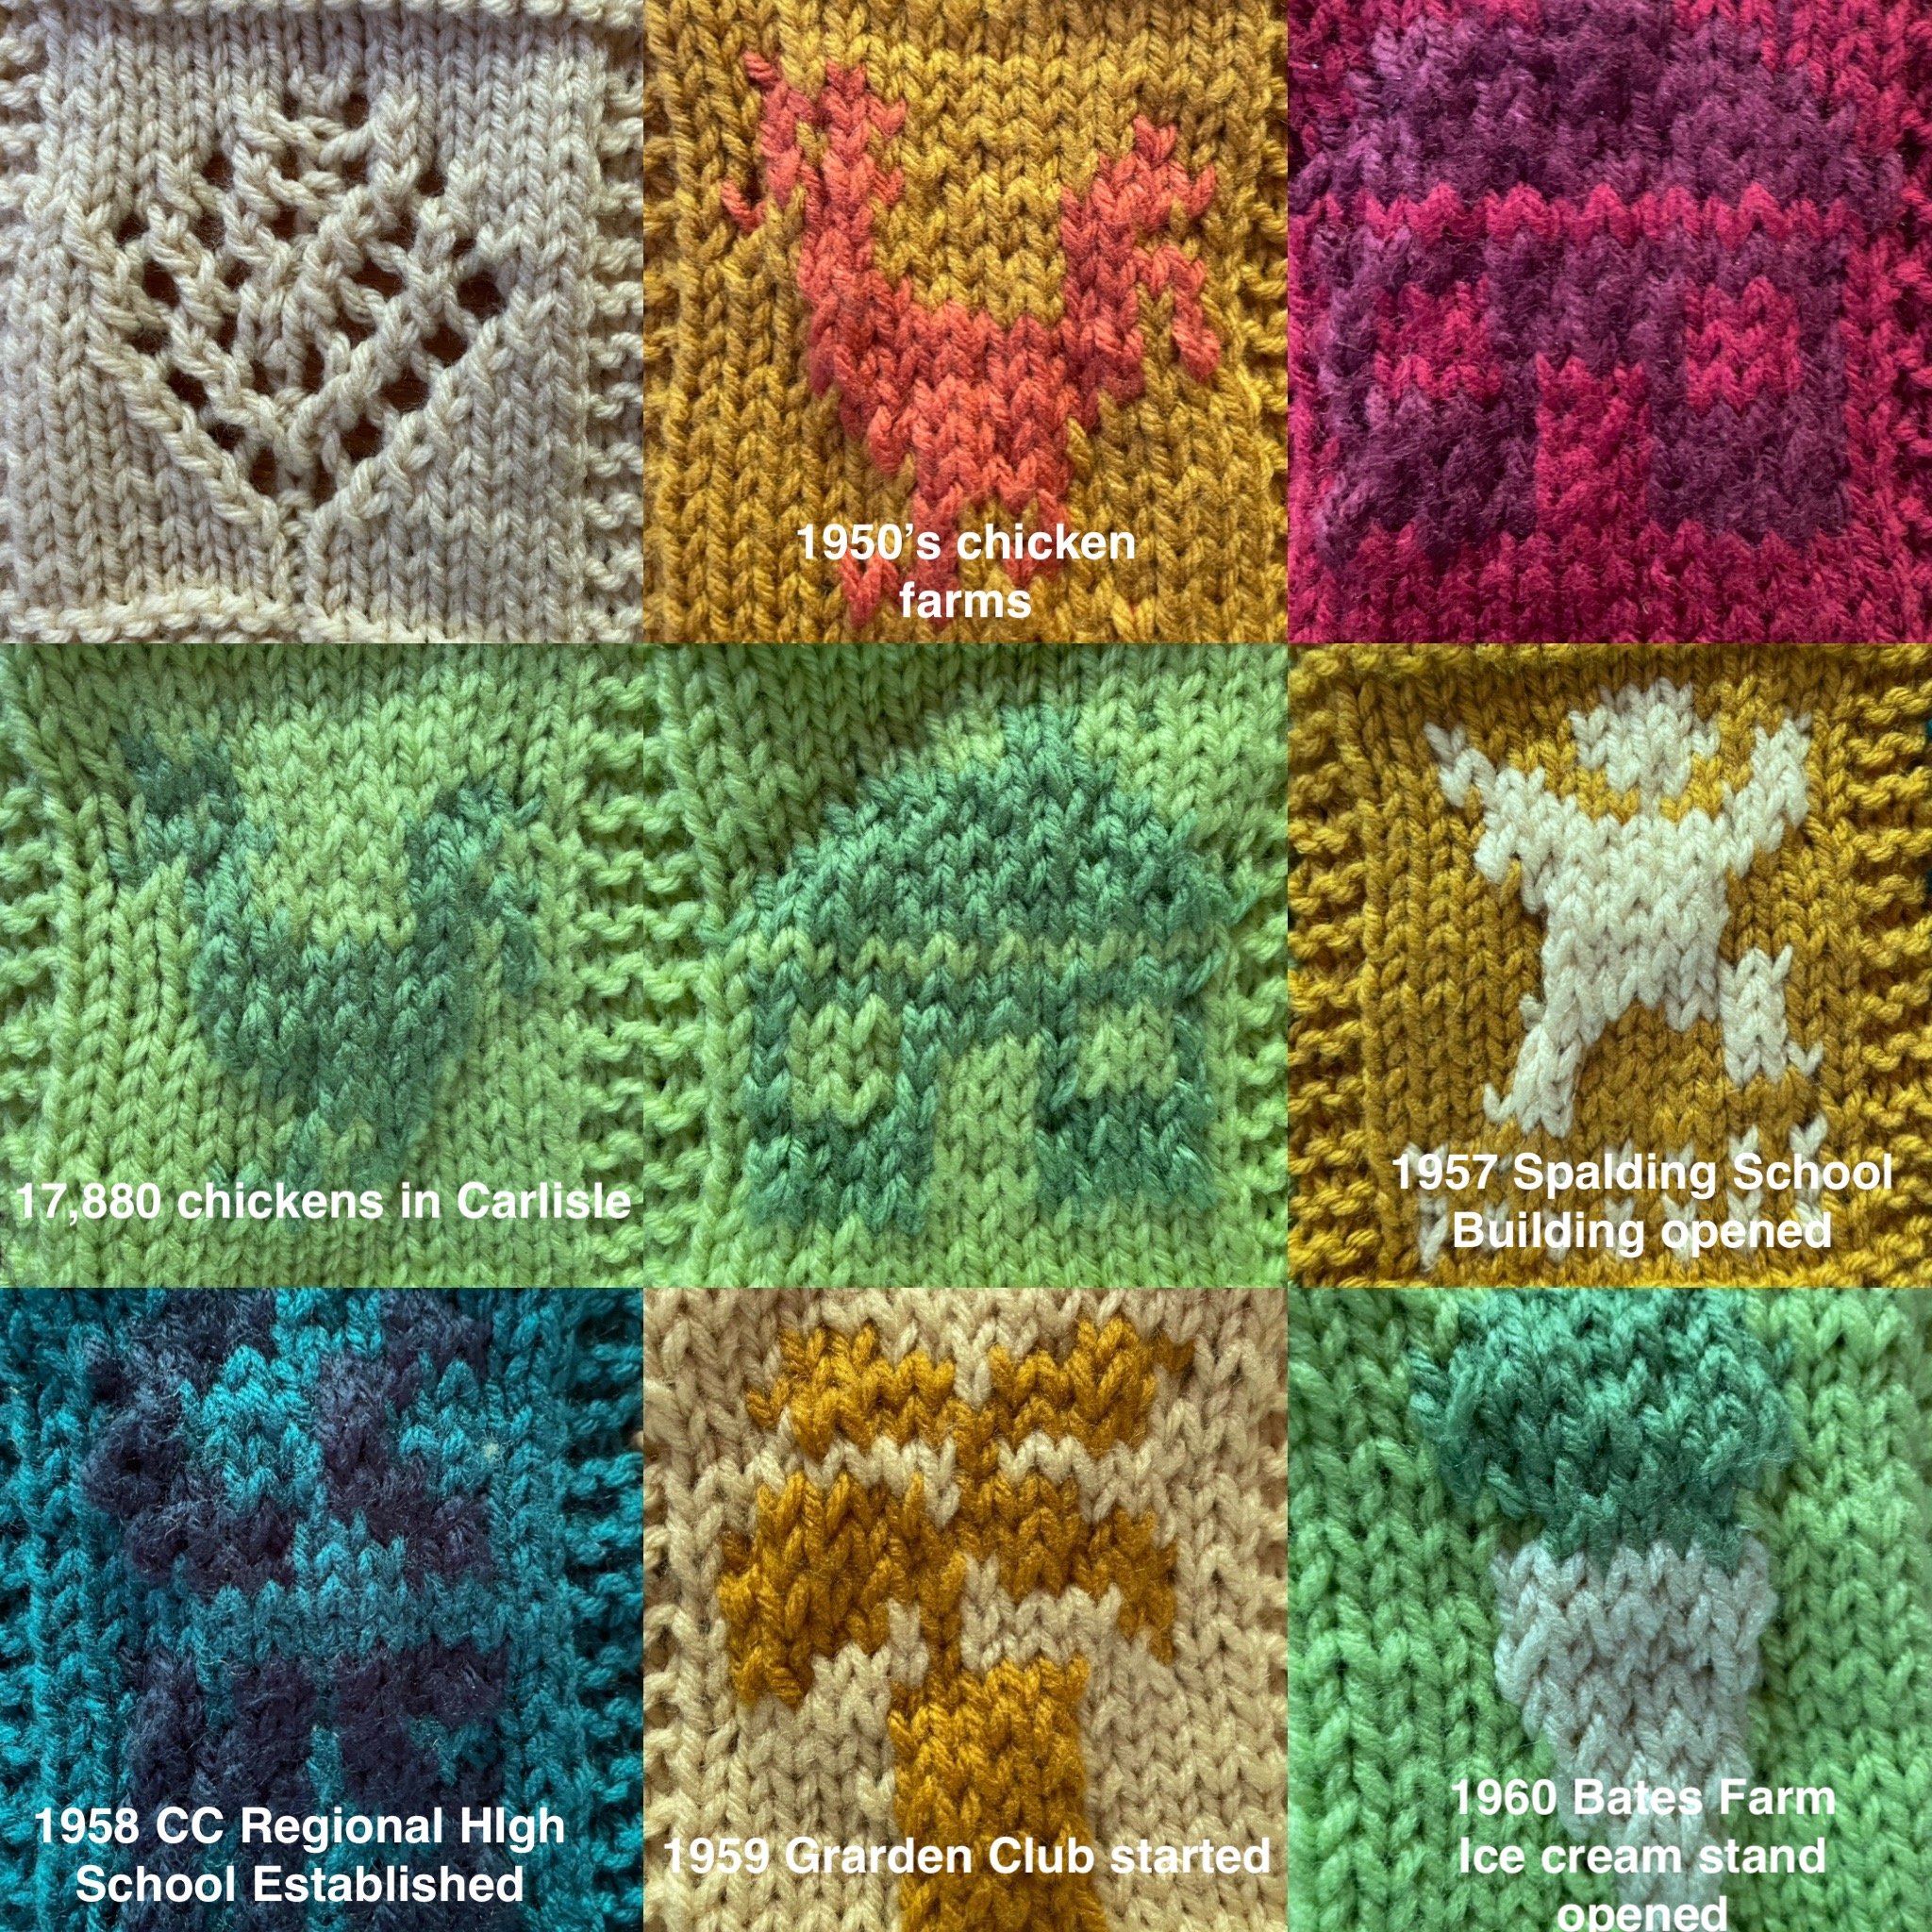
1951-1960

1931-40

1971-1980
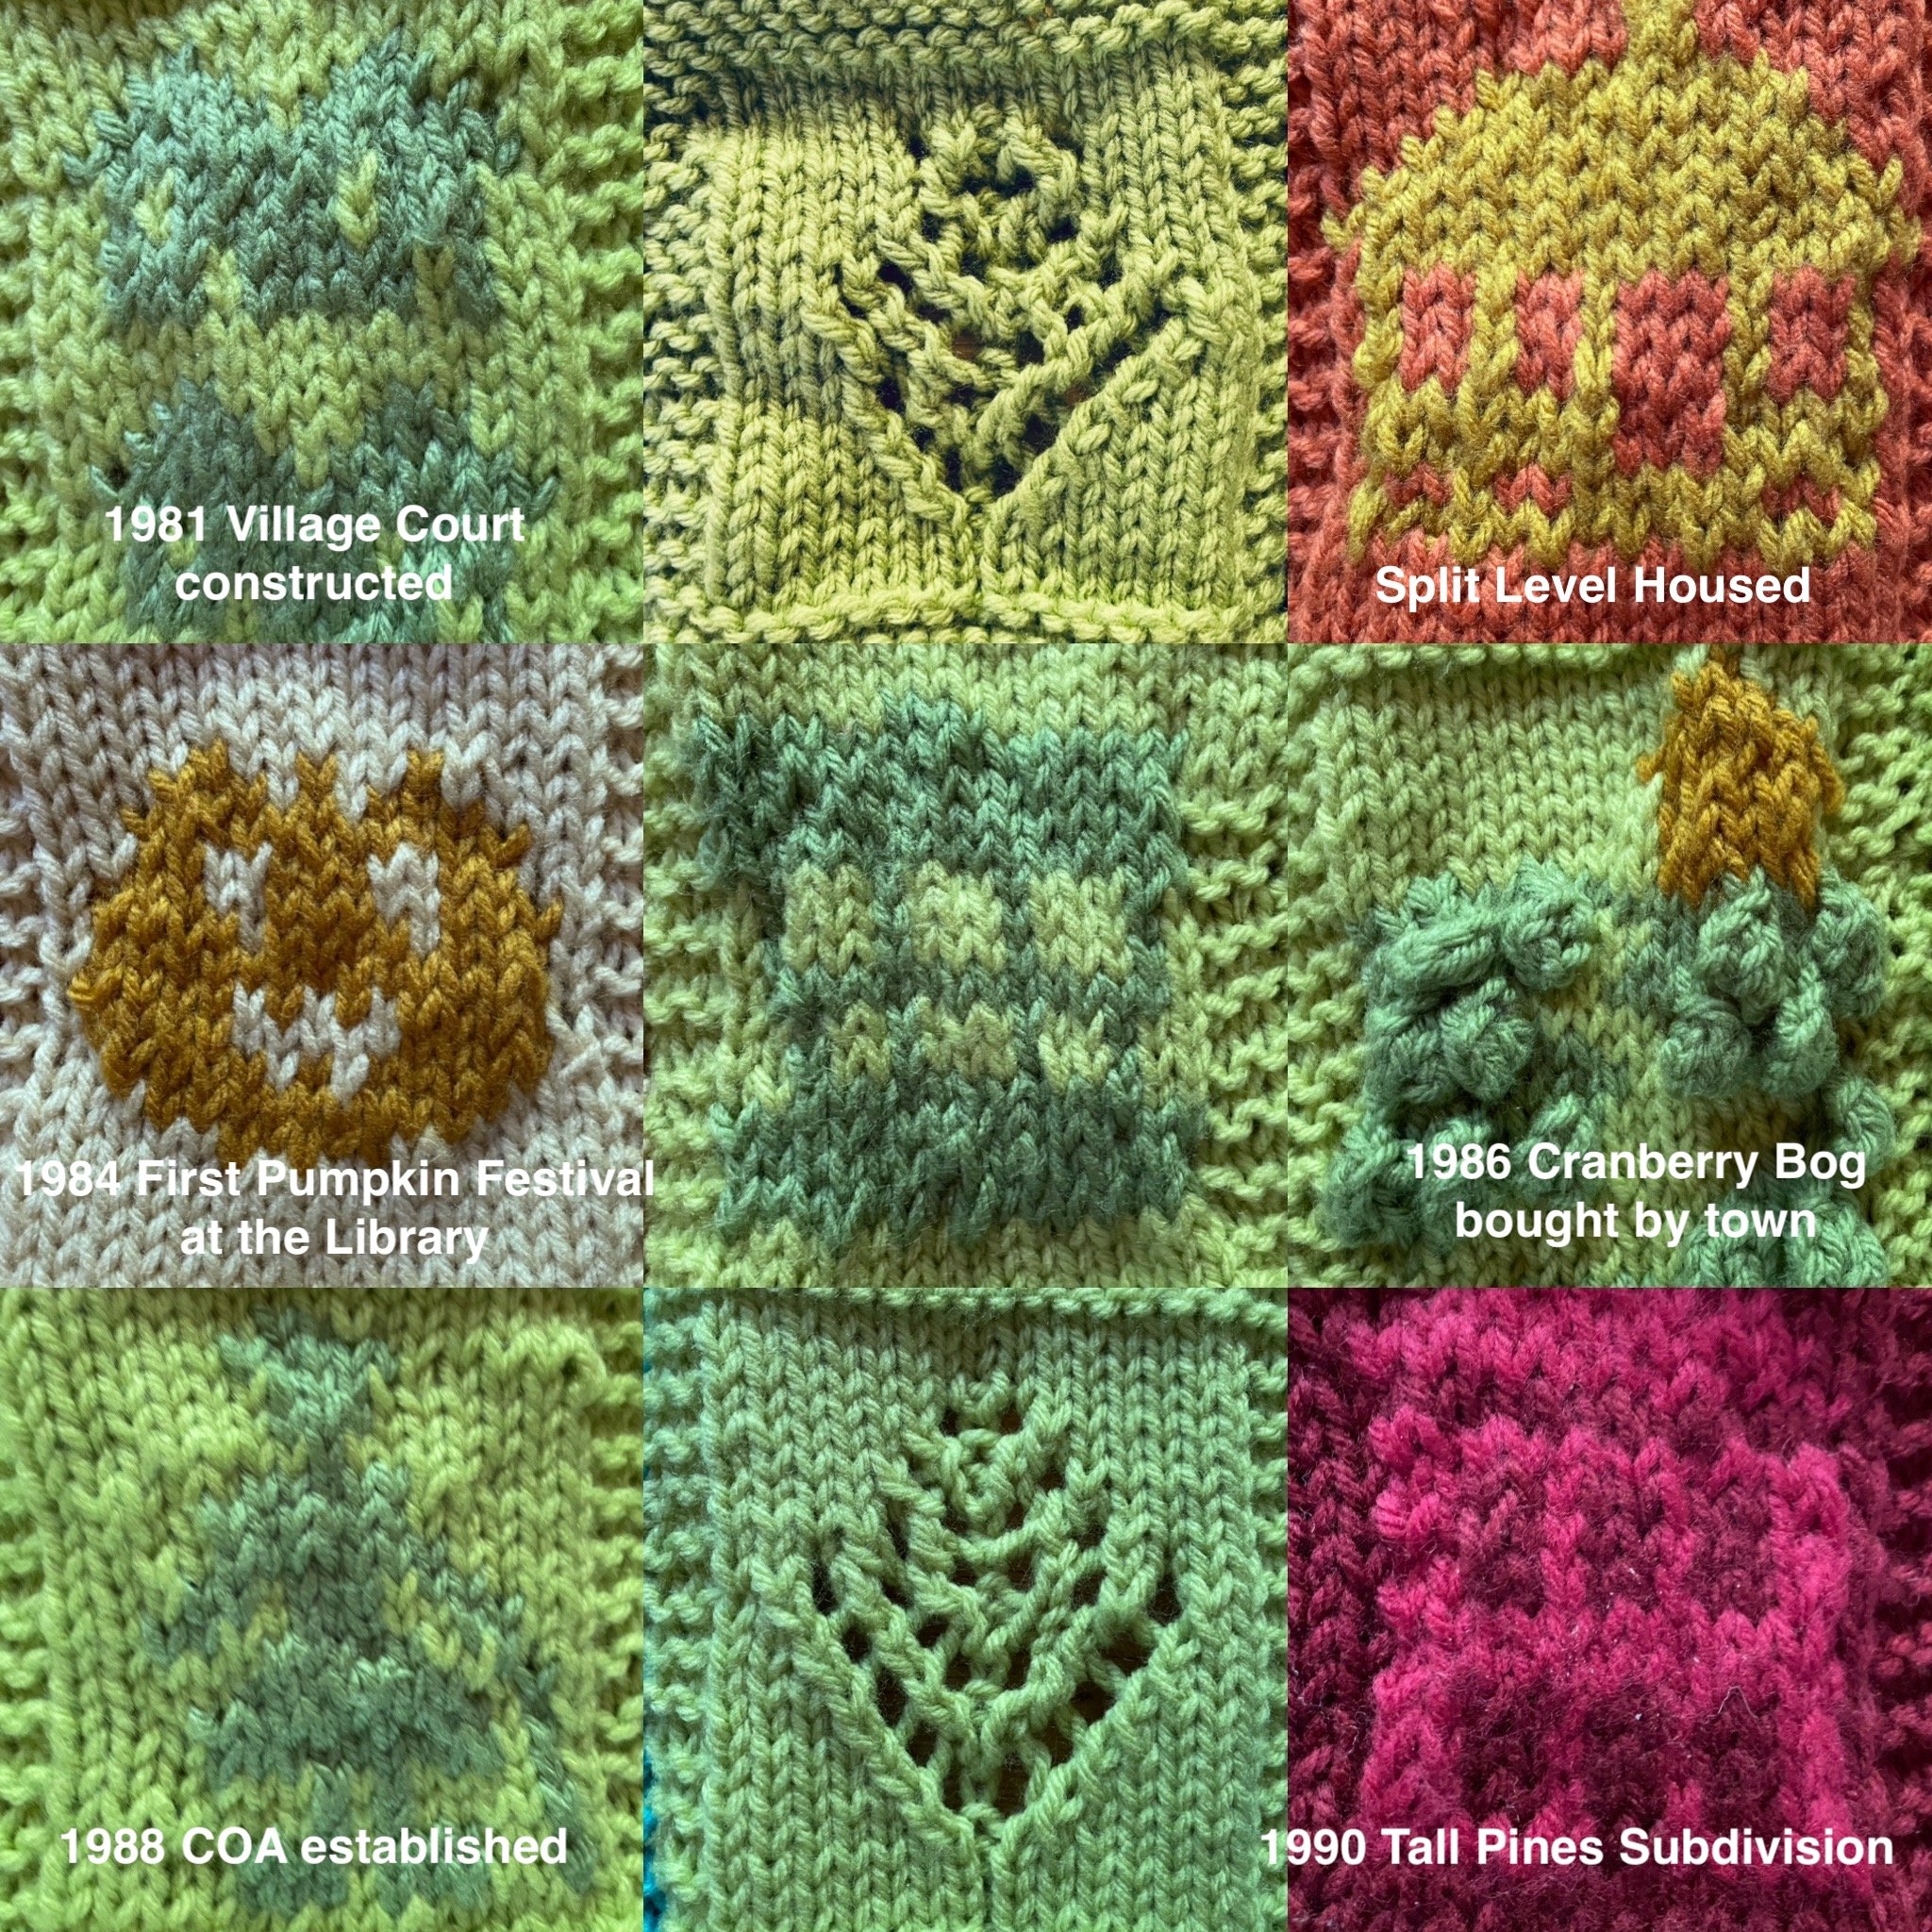
1981-1990
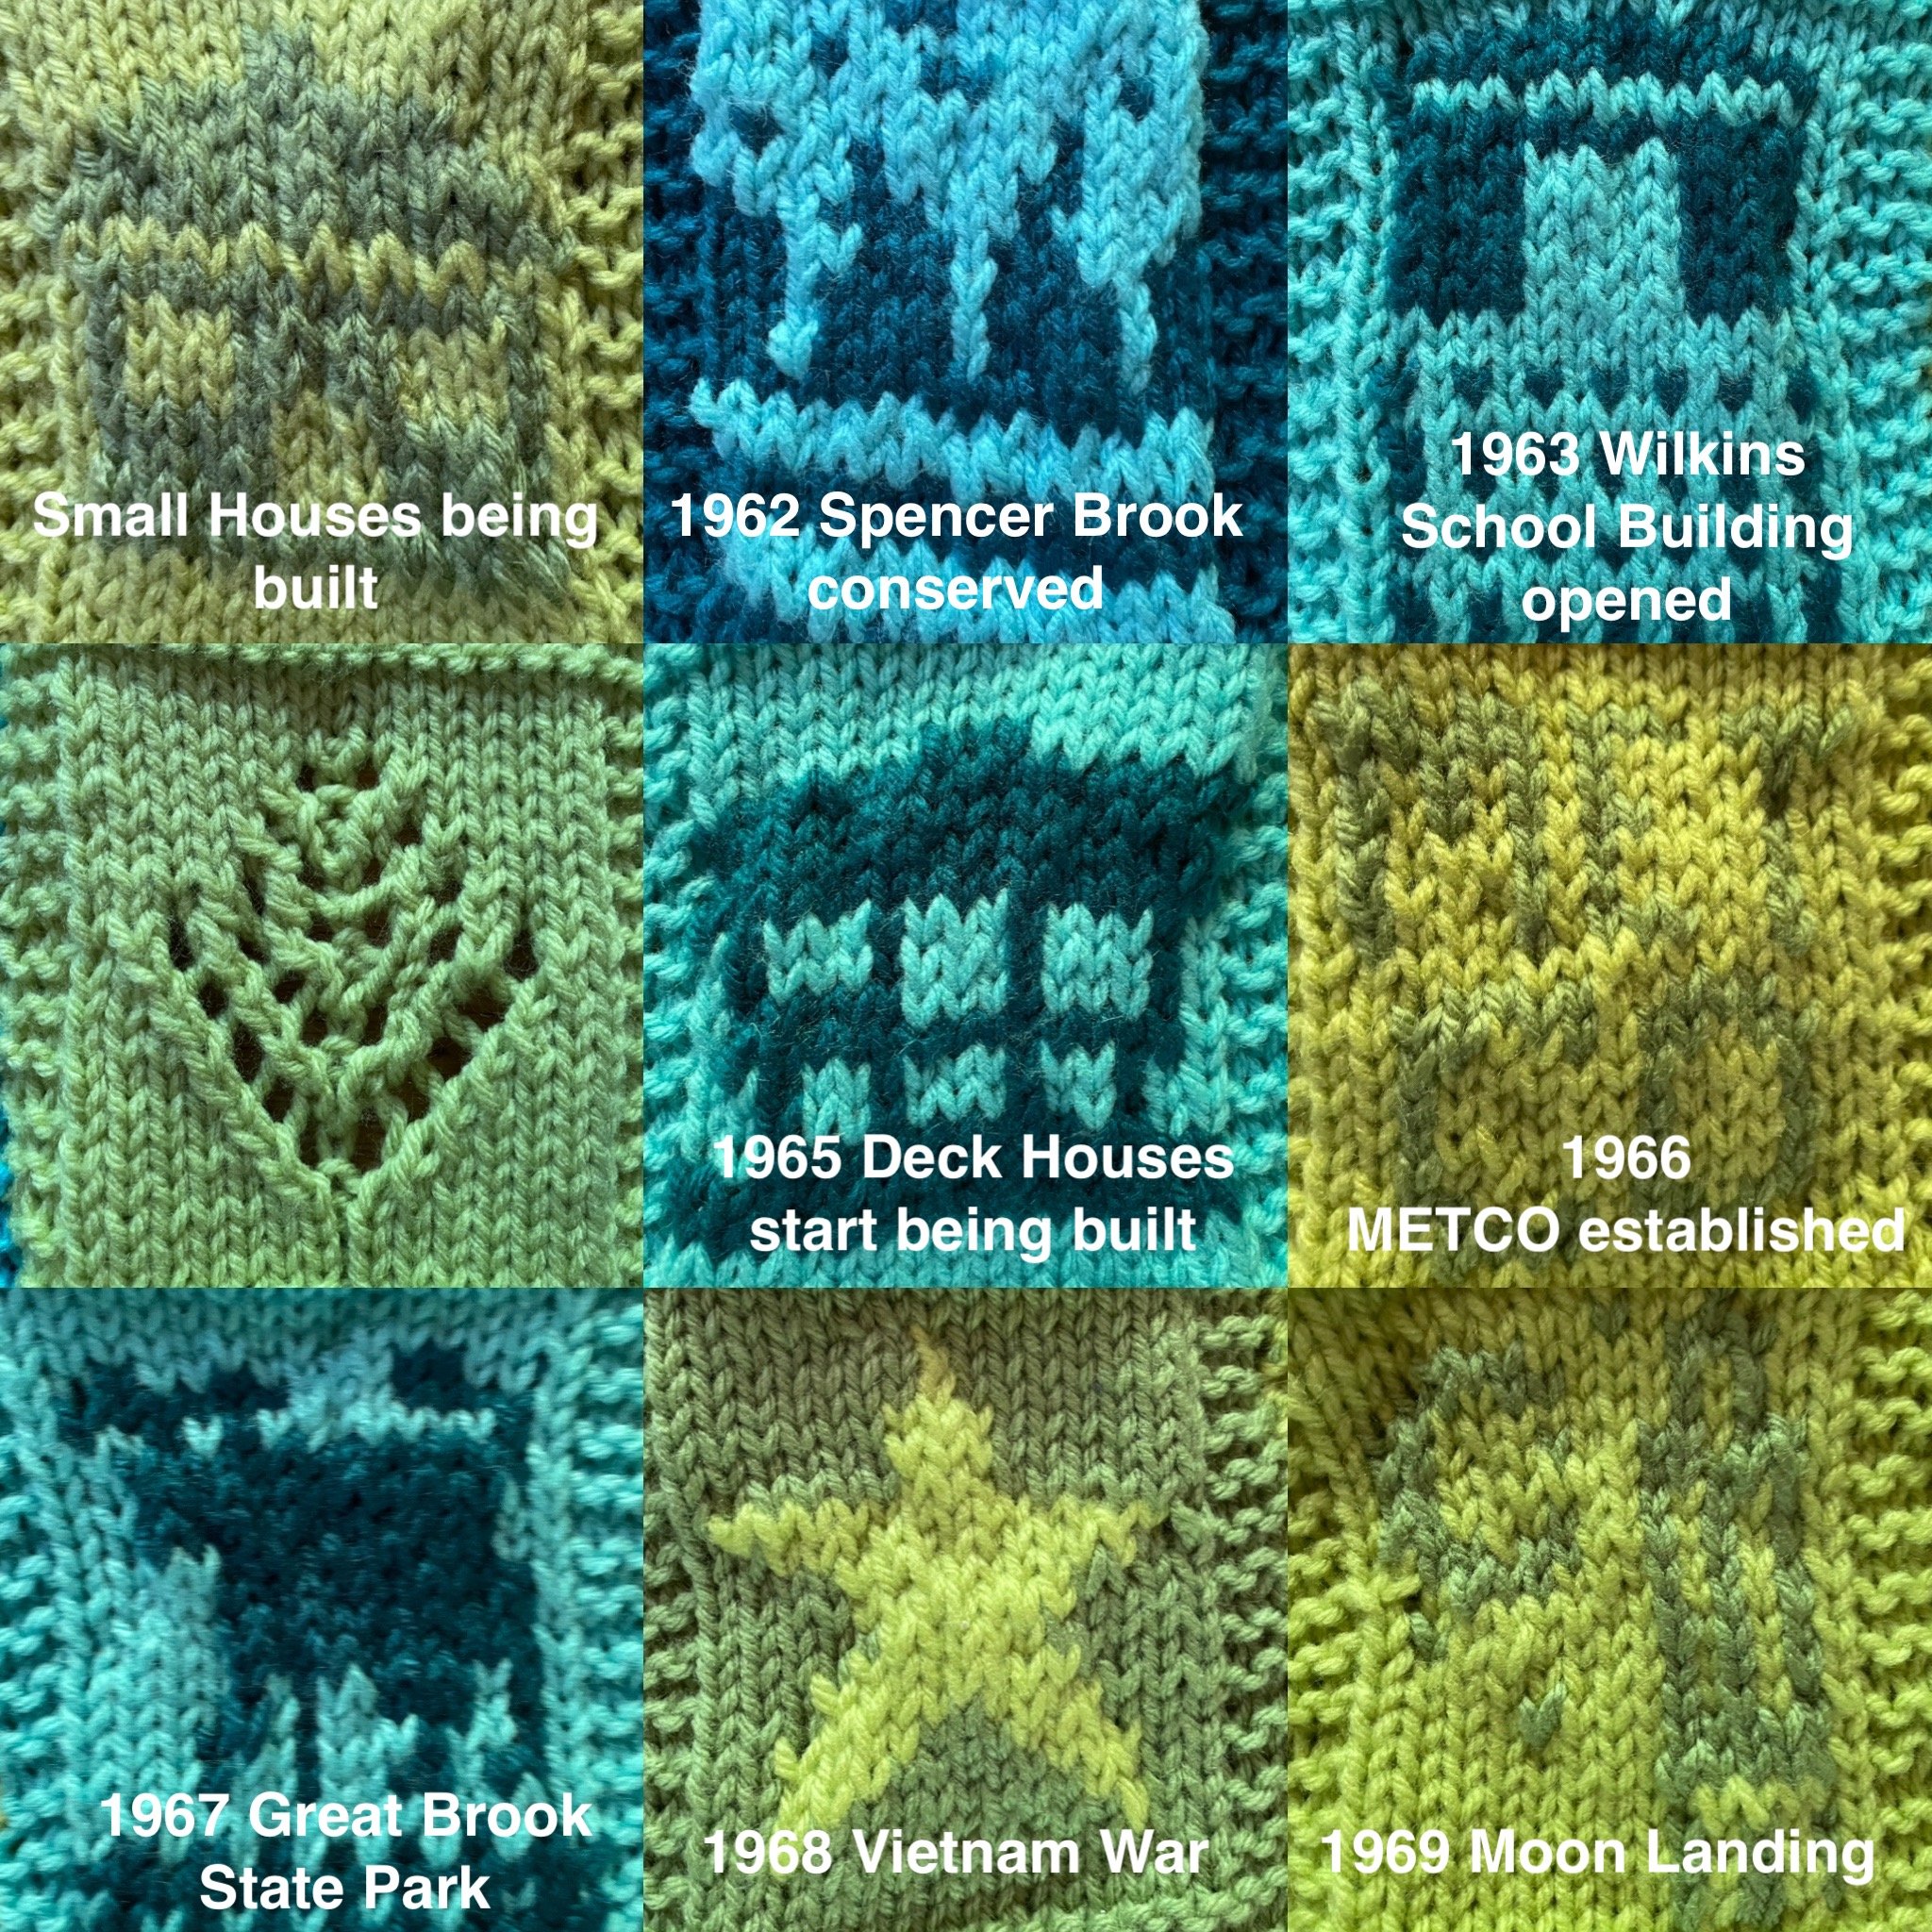
1961-1970

2001-2010

2011-2020
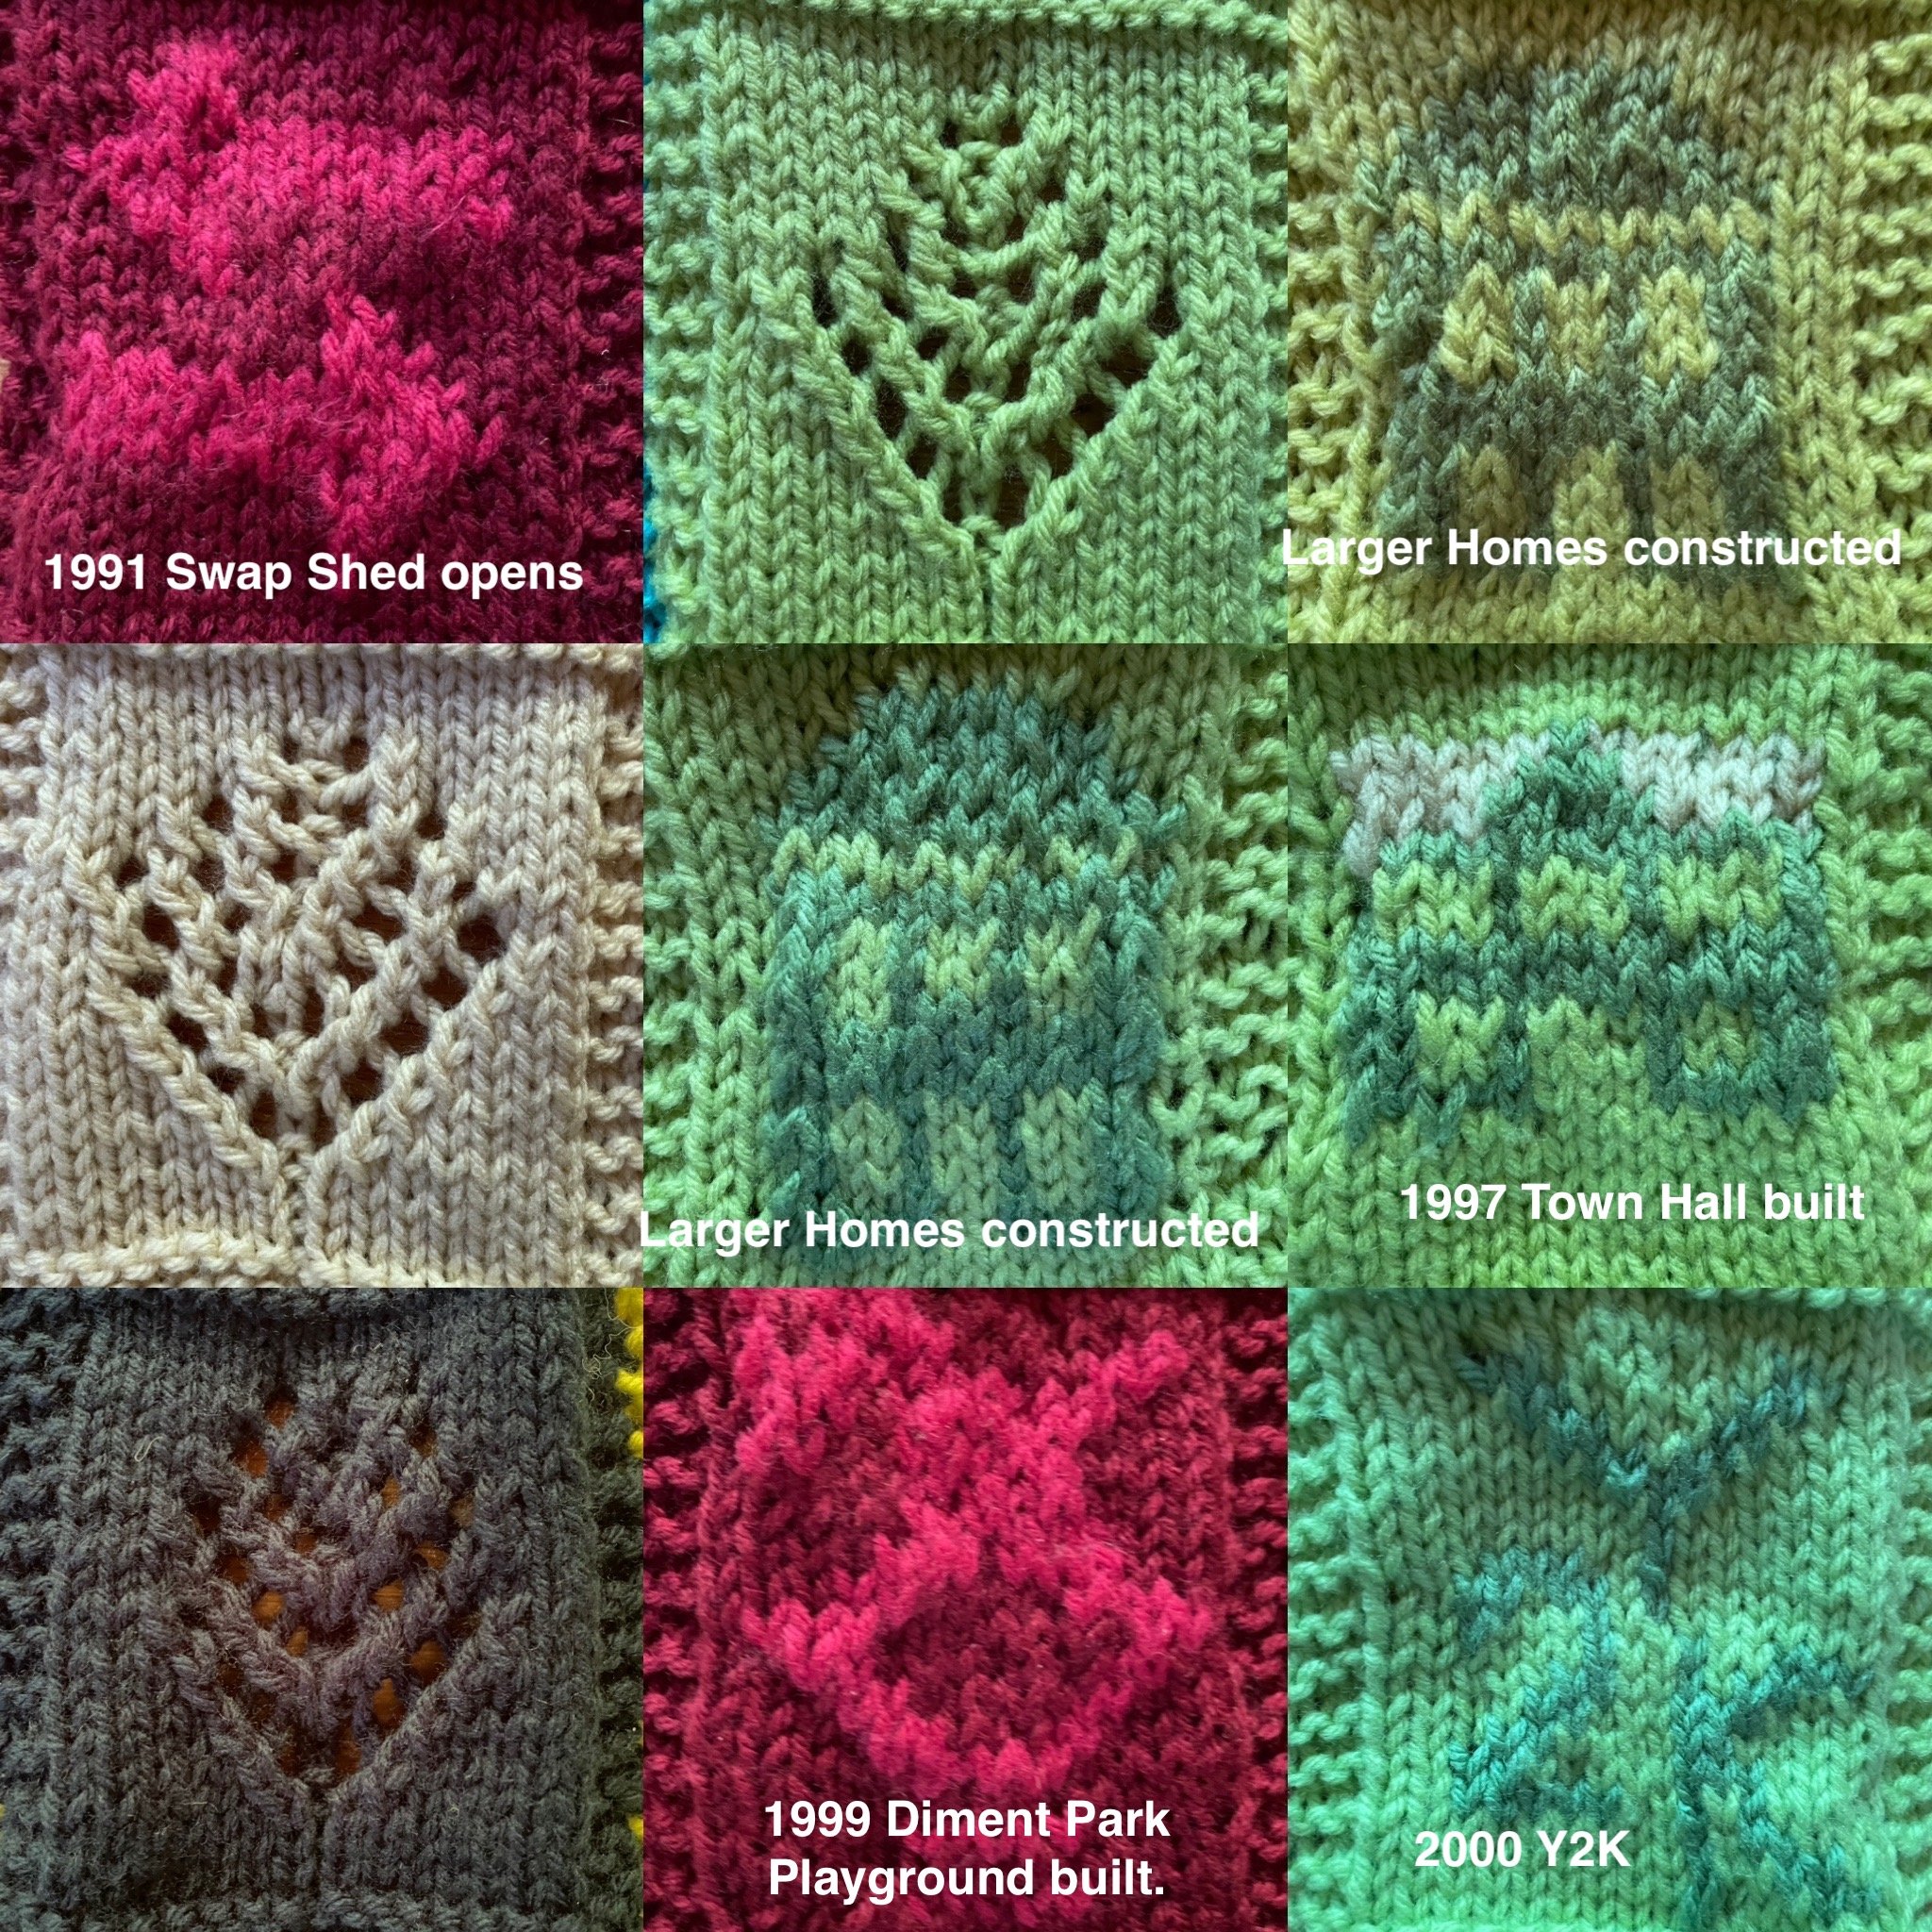
1991-2000

House sizes over the years